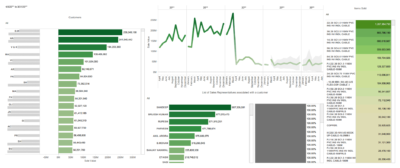
Dashboard 030 | Customer 360 & Gross Revenue Contribution | SalesOps


dashboard 030 customer dashboard
Offering(s):
Sales Operations
Prebuilt Solution:
Yes
Analytic(s):
Customer 360
Dashboard Summary

This dashboard is a view into customers' revenue activity. The revenue trends depict performance by year. The graph on the left shows the contribution towards total revenue by each customer. By clicking on any customer name gives a 360 degree view of the customer's revenue - the items purchased, the sales rep, the buying trend etc.

Connect with us
If you are here it means you want to start a journey. We would love to get to know you and take you on that journey. We'll be pefect for each other - you'll see...
Talk to an Expert at GainOps