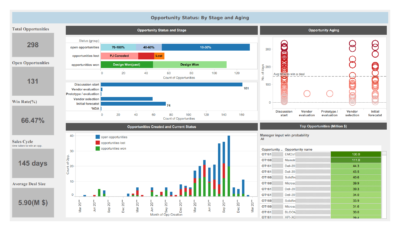
On the left of the dashboard are the sales opportunity metrics to evaluate how well the business is handling its opportunities.
The ‘Opportunity Status and Stage’ graph gives a breakdown of the number of opportunities at each stage of the sales process. The opportunity aging graph is the health of the sales pipeline. Opportunities that have been sitting too long at a stage can be identified and moved to the next stage. For example: on selecting the ‘40-60%’ status, we can see there are opportunities that have been at the discussion stage for more than 100 days. Fixing such duration bottlenecks will ensure the pipeline is efficient.
This along with the ‘top opportunities’ graph help to focus efforts on the best sales opportunities in the pipeline that are most likely to close and yield higher revenue.