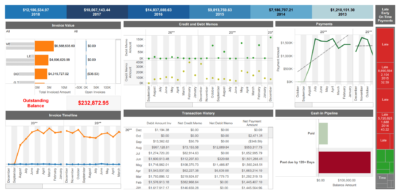
Is a to-date report of all customer related information. The top band shows total revenue by year. The graph on the left shows the contribution towards total revenue by each customer. To view for a particular year, click the year on the top band and the numbers will be recalculated in all other sections of the report.
Every graph on the dashboard can be clicked and used to filter the other graphs. This extensive filtering functionality allows 360 degree view of any customer information and helps identify the areas that need attention.